In our blog, we’ve talked a lot about how to launch a marketplace and how to create your own platform as a service provider.
However, what happens after you do so? The next step is to compile customer engagement analytics and embark on an ever-lasting journey of striving to improve the user experience on your marketplace.
You may already know that the cost of creating a professional service marketplace is not necessarily expensive beyond imagination.
We have more good news. Your no-code marketplace builder can also be your user engagement software!
After all, our ultimate goal is to help you build trust between parties in your marketplace, and what better way to do that than anticipating customers’ demand and meeting everyone’s expectations?
In this article, you’ll find how customer engagement analytics work, why they are so useful, and how you can employ them yourself.
Why customer engagement analytics is important?
Essentially, a customer engagement dashboard serves to help you understand customer behavior.
It presents insights into their preferences, buying habits, and feedback.
As Hubspot says, helps businesses to understand what their customers want and how to better engage with them.
Also, you can improve the user experience on your marketplace. By analyzing customer engagement data, businesses can identify pain points in the customer journey and take action to improve the customer experience. This can lead to higher customer satisfaction and loyalty.
As a result, engaged customers would be more likely to make repeat purchases and recommend your niche marketplace to others.
Thanks to this marketplace data, you can identify areas where improvement is needed and ultimately increase revenue.

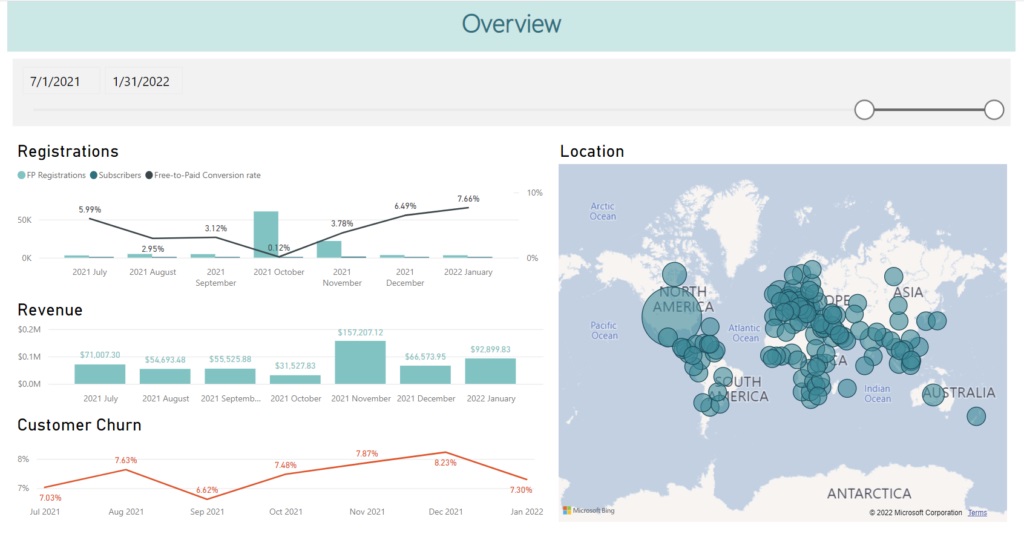
3veta’s in-depth user analytics feature helps you get regular insights into important user data.
Your customer engagement dashboard will also guide you toward the most effective marketing channels and campaigns. You’ll be able to optimize marketing efforts and increase the ROI of marketing spend.
Last but not least, customer engagement analytics over time can reveal trends in customer behavior and preferences. This information can be used to anticipate future customer needs and develop products and services that meet those needs.
How do you analyze customer engagement?
The first step towards successful marketplace analytics is to define what you want to measure.
Start by identifying the metrics that are most important to your business goals. This may include metrics such as customer satisfaction, customer loyalty, repeat purchase rate, and customer lifetime value.
After collecting customer engagement data via surveys, feedback forms, social media monitoring, web analytics, or customer service interactions, it’s time to analyze it.
You can rely on user engagement software to identify patterns, trends, and insights. This may involve segmenting the data by customer demographics, behavior, or location to gain a deeper understanding of customer preferences and needs.
If you’re new to this and it sounds complicated, you can use 3veta’s analytics module which provides you with an easy-to-use tailor-made user analytics dashboard.
After that, it’s all up to you.
Based on your analysis, you can develop strategies to improve customer engagement by optimizing marketing campaigns, improving customer service, personalizing communications, or developing new products and services that better meet customer needs.

Make sure to constantly keep an eye on what’s going on. It’s important to continue collecting and analyzing customer engagement data over time to track progress and identify areas where further improvements can be made.
What metrics do you have to measure?
Several metrics can be used to measure customer engagement. The specific metrics that a business chooses to measure may vary depending on its goals and the nature of its customer interactions.
Even so, some common metrics can be used by all types of marketplaces no matter the business model or the services offered.
Customer satisfaction
Measures how content customers are with your products, services, or overall experience. It is typically done using surveys or feedback forms.
Net promoter score (NPS)
This metric measures how likely customers are to recommend a business to others. It is typically measured using a survey question that asks customers to rate how likely they are to recommend the business on a scale of 0 to 10.
Customer lifetime value (CLV)
It shows the total amount of revenue that a customer is expected to generate for a business throughout their relationship. It takes into account factors such as purchase frequency, average order value, and customer retention rates.
Repeat purchase rate
Displays the percentage of customers who make more than one purchase from a business. It is a good indicator of customer loyalty and can be used to assess the effectiveness of retention strategies.

Time on site
Measures how long customers spend on a business’s website or mobile app. It helps evaluate the effectiveness of customer engagement with digital content and can be used to identify areas for improvement.
Social media engagement
This metric measures how customers interact with a business on social media, including likes, shares, comments, and mentions. It can be used to assess social media marketing and to identify opportunities for engagement.
Whether you own a B2B, B2C, or peer-to-peer marketplace that offers coaching, consulting, repairing, or other services, the above-mentioned metrics create key analytics reports for marketplaces of all types.
How to use data to improve user experience on your marketplace?
If you want to make your service marketplace a better place for your users, you need to use data to help guide your decisions. Here’s what you need to do.
After collecting marketplace data, you should start looking for patterns and trends that can help you understand what’s working well and what isn’t.
You might notice that users are having trouble finding certain services, or that they’re not completing their purchases. This kind of information can help you prioritize the areas that need improvement the most.
Once you’ve identified the areas that need work, you can start making changes. You might need to redesign your website to make it easier to use, or you might need to simplify the checkout process.
💡 Pro tip
If you don’t have a tech support team and you’re not familiar with coding, you can use 3veta – our no-code marketplace builder.

Finally, you need to keep monitoring your data over time. This means continuing to collect information about how users are interacting with your marketplace and using that information to make further improvements.
Overall, using data to improve the user experience on your marketplace is a crucial step in making sure that your users are happy and coming back for more.
So go out there, gather your analytics for customer engagement, and use them to scale your service marketplace!
To sum it up
If you’re still at the beginning of your journey, we warmly recommend you find a white-label marketplace builder like 3veta that will not only take care of the programming for you but will also equip you with good marketplace analytics.
One of the key steps needed to scale your service marketplace is to avoid the hassle of switching between different tools all the time. You can have all marketplace features in one place and save time and money.
If you still need some convincing, have a look at our interactive demo and see for yourself how 3veta works in practice.
